
Digitec Product Recommendation Networks - Dataset Construction and Community Detection
Overview
A network science project that builds a novel dataset by scraping product recommendations from digitec.ch - Switzerland's largest electronics retailer - and analyzes the resulting graph for community structure. The deliverable has two parts: the scraping pipeline that turns Digitec's GraphQL API into a clean recommendation graph, and a comparative study of four community detection algorithms (CNM, Label Propagation, Louvain, Girvan-Newman) on the resulting networks, benchmarked against published results on Amazon co-purchase data. Co-authored with Amos Calamida, Carol Ernst, and Nicolas Meyer.
Two networks were extracted in detail:
| Network | Nodes | Edges | Density | Avg. degree |
|---|---|---|---|---|
| Smartphones & accessories | 5,351 | 23,458 | 0.00082 | 8.77 |
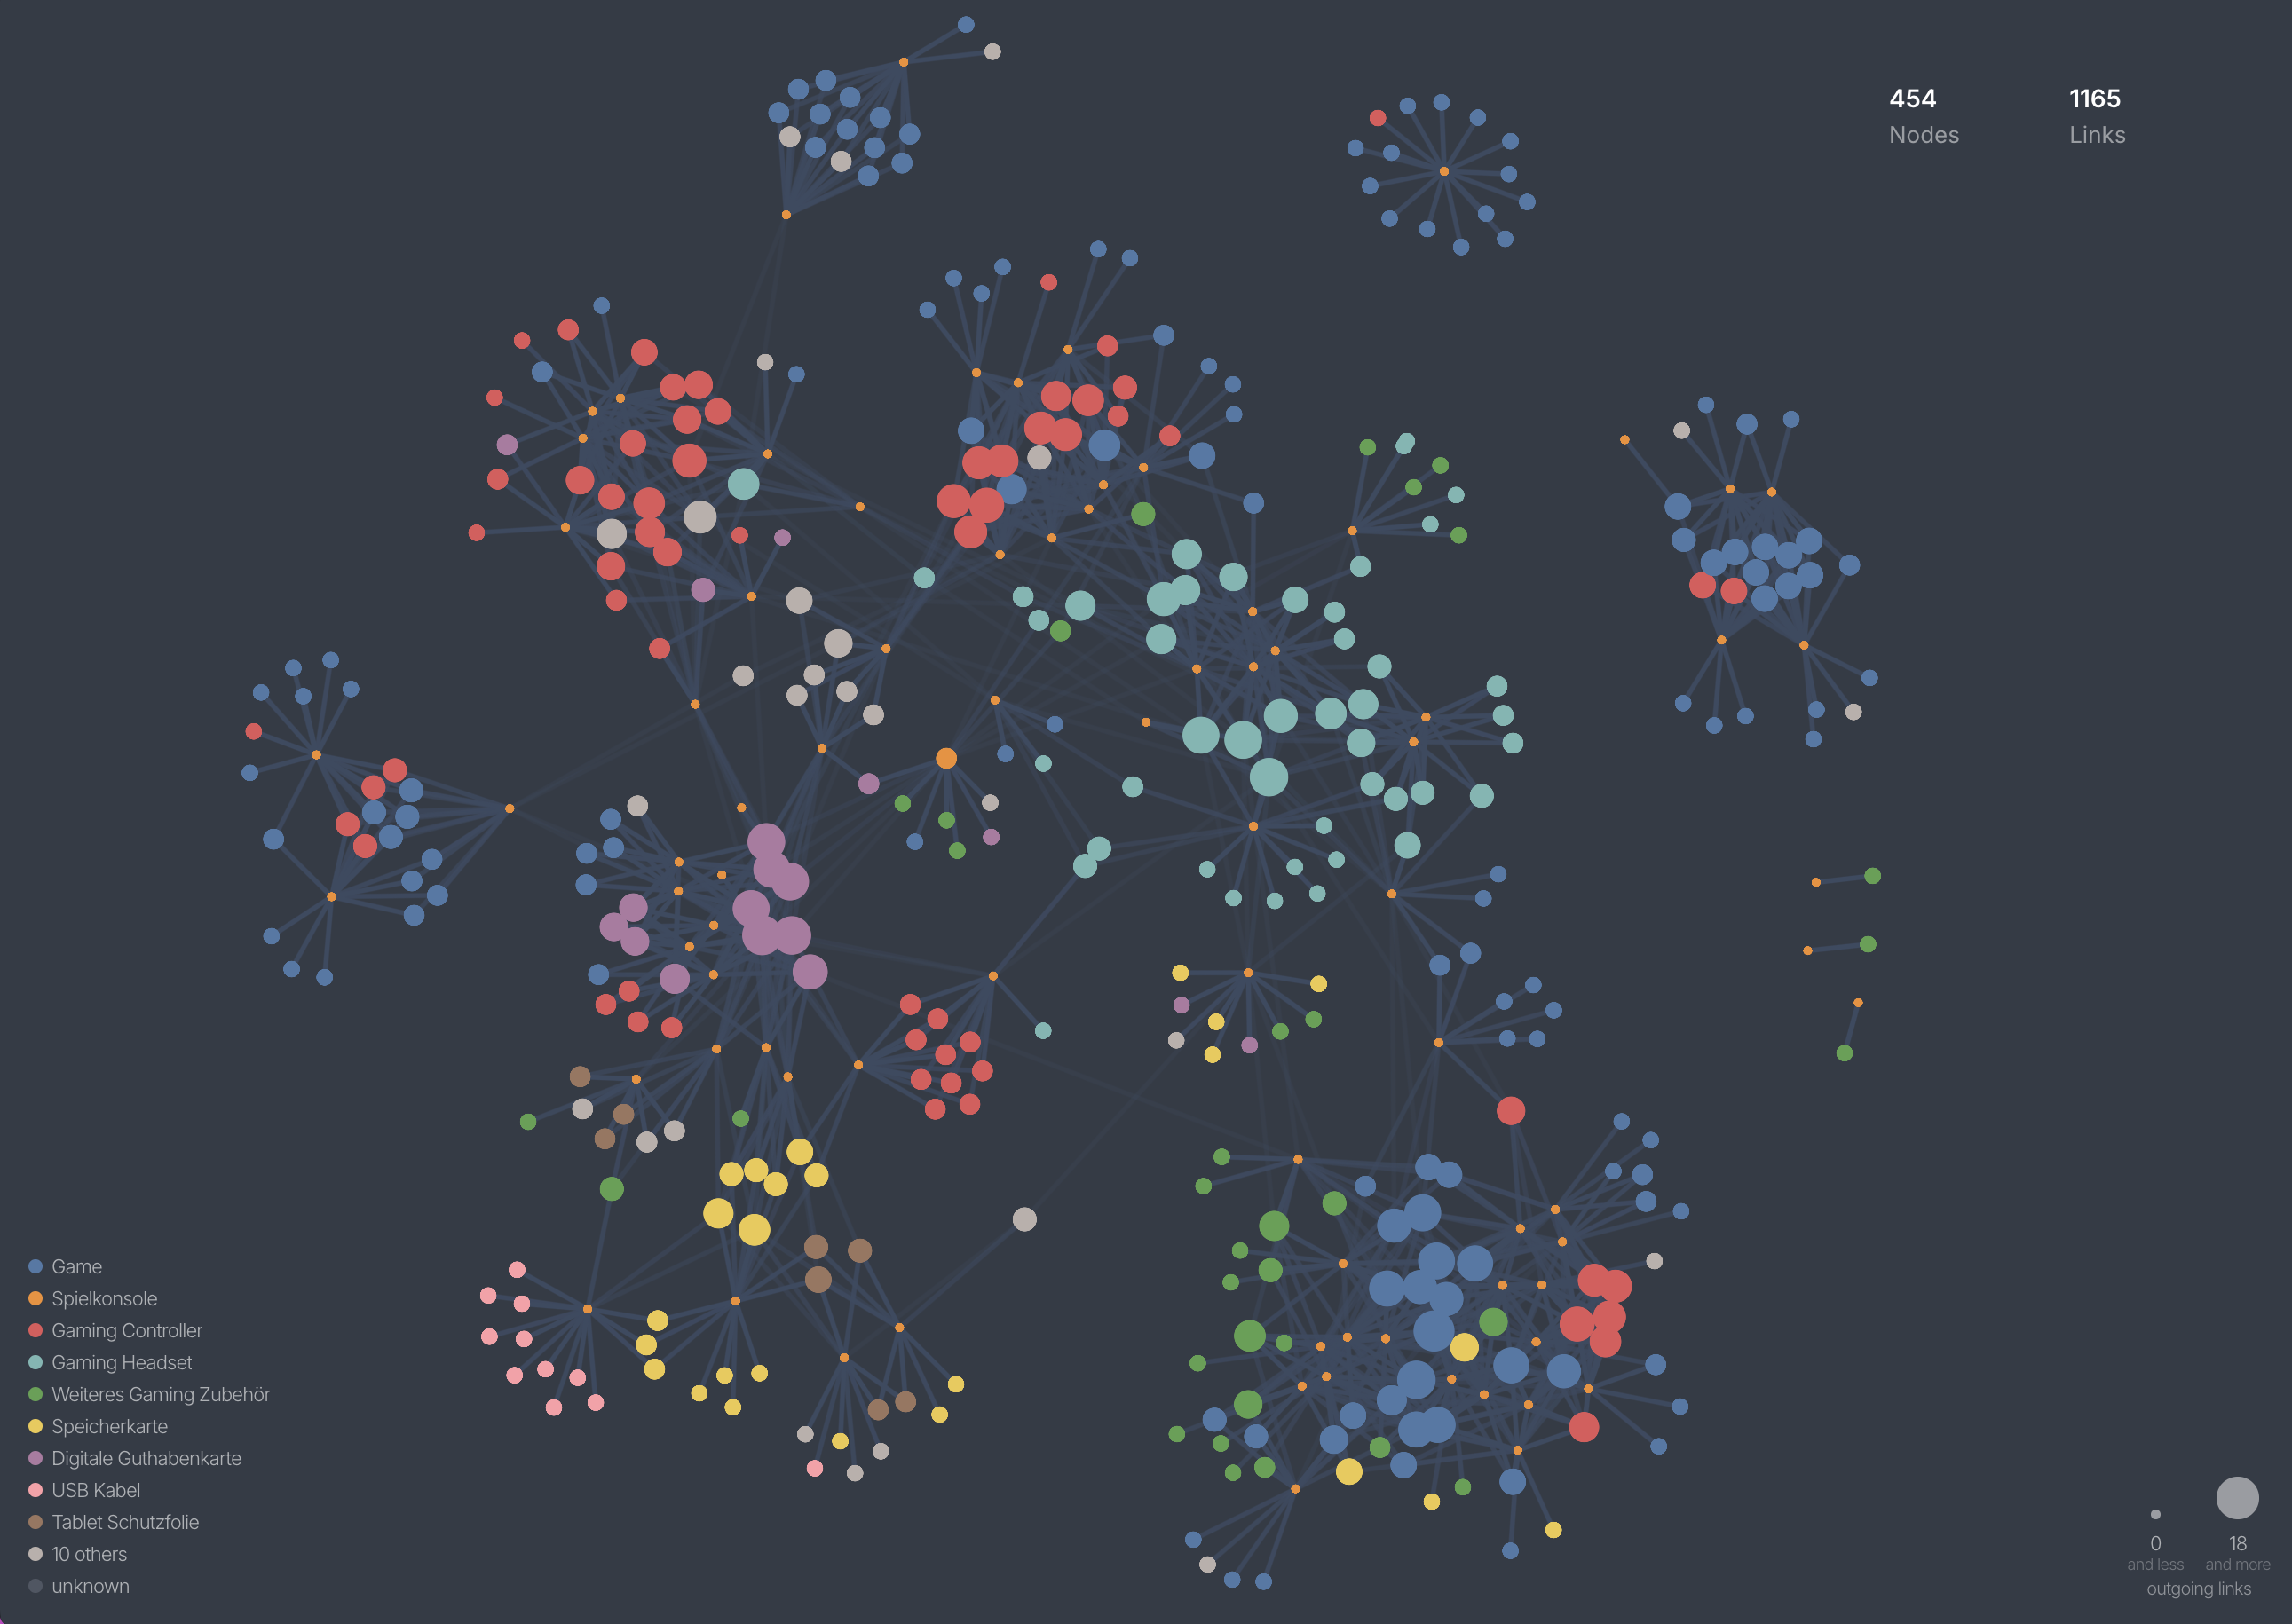
| Gaming consoles & accessories | 468 | 1,165 | 0.0053 | 4.98 |
Motivation
Network science coursework typically reuses a handful of canonical datasets - Zachary's karate club, Amazon co-purchase, citation networks, Twitter follows. Two problems with that: (1) the datasets are old enough that any "novel" finding is really a re-finding, and (2) e-commerce recommendation graphs specifically are an interesting object of study in their own right, but the publicly available ones (Amazon) reflect a single market and a co-purchase relationship rather than the recommendation relationship that actually shapes user behavior on the site.
So the project had a dual goal: produce a clean, reusable dataset of Swiss e-commerce recommendation structure, and use it to ask whether community detection methods that work well on Amazon also work well on a smaller, more focused, recommendation-driven graph.
The three research questions were:
- ·Can a network-analysis-suitable dataset be constructed from Digitec?
- ·Which community detection algorithm performs best on it?
- ·How does that performance compare to prior work on Amazon co-purchase data?
Technical Approach
Data collection from Digitec's GraphQL API
Digitec exposes a GraphQL API with three relevant endpoints: list all products in a category, fetch accessories for a product, and fetch similar products for a product. The scraping pipeline walks these in two passes - first enumerating all product IDs and attributes per category, then querying each product's neighbors.
Two practical concerns shaped the scraper:
- ·Anti-bot evasion. Randomized sleep intervals between requests and rotated user-agent strings, mimicking realistic browsing patterns. The catalog endpoints tolerated higher rates than the per-product endpoints, so the two passes ran at different throttles.
- ·Dynamic pricing. Digitec adjusts prices in near-real-time, so every scraped record is timestamped. Any analysis that uses price has to treat it as a point-in-time snapshot, not a stable attribute.
The full attribute set per product: brand, type, category, price, rating count and score, name, name extensions, availability, energy efficiency, sales information, and the relative URL. The full pipeline is implemented in four scripts (1_scrape.py → 2_postprocess.py → 3_create_network.py → 4b_graph_evaluation.py) plus a Jupyter notebook for exploratory analysis.
Network construction
Each product became a node; each recommendation became a directed edge. Two recommendation types - "similar products" and "accessories" - were merged into a single graph rather than analyzed separately, because Digitec's UI surfaces both in the same recommendation slots from the user's perspective.
Graphs were stored in both GML (for NetworkX/programmatic analysis) and GEXF (for Cosmograph's interactive visualization). The Cosmograph exports use separate node and edge CSV files keyed by category.
Structural analysis
For each network, the standard battery:
- ·Degree distribution (overall, in-, out-)
- ·Connectivity (strongly and weakly connected components)
- ·Density and average clustering coefficient
- ·Centrality measures: in-degree, out-degree, betweenness, closeness
The structural patterns differ sharply between the two networks. The smartphone graph is dominated by accessory hubs - a single USB-C-to-USB-C cable has in-degree centrality 0.1445, meaning it is recommended on roughly 14% of all smartphone-adjacent product pages. The gaming console graph is smaller and more category-coherent: Mario Kart 8 Deluxe tops in-degree at 0.0407, and the network has tighter clustering around console families.
Clustering coefficients are effectively zero in both networks - recommendation graphs don't form triangles, because if A recommends B and B recommends C, the retailer's recommender doesn't automatically close the loop by having A recommend C. This is structurally different from social networks and is worth keeping in mind when applying methods designed for triadic-closure-heavy graphs.
Community detection
Four algorithms, chosen to span the major families (modularity-optimizing greedy, label propagation, hierarchical modularity, edge-betweenness):
| Algorithm | What it optimizes | Family |
|---|---|---|
| Greedy Modularity / Clauset-Newman (CNM) | Modularity, agglomerative | Modularity |
| Label Propagation (LPA) | Local label consensus | Diffusion |
| Louvain | Modularity, hierarchical | Modularity |
| Girvan-Newman (GNM) | Edge betweenness removal | Divisive |
Results
Community detection comparison
| Algorithm | Smartphone (n=5,351) | Gaming Console (n=468) | Amazon co-purchase (n=548,552, prior work) |
|---|---|---|---|
| Communities / Modularity | Communities / Modularity | Modularity | |
| CNM | 281 / 0.5272 | 29 / 0.7541 | 0.5565 |
| LPA | 363 / 0.3598 | 39 / 0.7342 | 0.5515 |
| Louvain | 251 / 0.5855 | 28 / 0.7588 | 0.5741 |
| GNM | 156 / 0.0111 | 21 / 0.4836 | 0.5320 |
A few patterns to call out:
Louvain wins on the Digitec data. Across both Digitec networks, Louvain produces the highest modularity. This matches what's commonly reported in the literature for medium-sized graphs and is the answer to research question 2.
The smaller network has better-defined communities. Modularity scores on the Gaming Console network (~0.75 for the top three algorithms) substantially exceed both the Smartphone network (~0.55) and the Amazon benchmark (~0.55). The interpretation: when a network is narrow (one product category, tight accessory relationships), recommendation structure is highly modular because most edges stay within a console ecosystem. When the network is wide (smartphones span many brands, accessories, cables, cases), the modularity ceiling drops.
GNM collapses on the Smartphone graph. Modularity of 0.0111 is essentially random partitioning. Edge-betweenness as a community signal breaks down when the graph has a dense recommended-everywhere hub structure - the high-betweenness edges aren't the ones separating communities, they're the ones touching the hubs. GNM is also computationally infeasible at much larger scales, so this isn't surprising in retrospect, but the magnitude of the drop was the project's most striking finding.
Comparison to prior work
Choudhary, Singh & Kumar (2023) report modularity scores around 0.55 for CNM, LPA, and Louvain on Amazon's co-purchase data. The Digitec smartphone results land in that neighborhood; the gaming console results substantially exceed it. Two factors plausibly explain the gap:
- ·Recommendation vs. co-purchase. Digitec's recommendations are curated (algorithmic, but constrained to a small set per product page). Amazon co-purchase is empirical (anyone who bought X also bought Y). Curated recommendations are likely more category-coherent and therefore more modular.
- ·Category focus. Our networks cover one product category at a time. Amazon's spans the full catalog, so its communities reflect category boundaries that are already implicitly enforced in our data.
This means the Digitec dataset's high modularity isn't necessarily a "better dataset" - it's a different kind of object, and the comparison is more apples-to-pears than apples-to-apples.
Challenges
Scraping at the right rate. Too aggressive and Digitec rate-limits or blocks; too cautious and the full catalog takes days. The chosen rates landed on roughly one product page per few seconds, with category enumeration faster. The pipeline supports resuming from a --start_product_id offset, which mattered when long-running scrapes died mid-run.
Dynamic pricing made price-based analysis fragile. Initial research questions included "is centrality correlated with price?" We collected the data and could compute the correlation, but the price snapshot drifted enough during scraping that the cross-sectional analysis was less clean than the structural analysis. We deprioritized it in favor of community detection, which depends only on the topology.
Recommendation graphs don't behave like social graphs. The zero clustering coefficient surprised us initially. In retrospect it's obvious - directed recommendation edges, curated by a retailer, have no reason to form triangles - but it meant a number of off-the-shelf network metrics either returned trivial values or didn't apply at all.
Computational ceiling on Girvan-Newman. GNM's edge-betweenness recomputation makes it O(VE²) per iteration. On the 23k-edge smartphone graph it was already slow; on a full-catalog Digitec scrape it would be intractable. This is a known limitation but it's worth seeing firsthand on a real dataset.
System Design
The pipeline is four scripts plus a notebook, designed to be re-runnable per category:
Storage layout:
- ·
results/- raw product JSON, one file per scrape batch - ·
recommendations/- raw recommendation JSON, one file per scrape batch - ·
clean_data/- final Parquet (analysis-ready), CSV (Cosmograph-ready), GML and GEXF (graph)
Parquet was the right choice for the cleaned tables - columnar, fast to filter, and small. CSV is kept only for tools (Cosmograph) that won't accept anything else.
Learnings
A novel dataset is sometimes more useful than a novel method. The project's core contribution is the dataset itself - a Swiss e-commerce recommendation graph that didn't exist publicly before. The community detection comparison is a standard application, but it's the dataset that makes future work possible.
Algorithm choice interacts with graph structure more than with graph size. GNM's collapse on the smartphone network isn't about 5k vs. 500 nodes; it's about hub density. The same algorithm on a similarly-sized but less hub-dominated graph (gaming consoles) is still mediocre but functional. This is a useful intuition pump: before picking a community detection method, look at the degree distribution.
Pre-publishing data for reproducibility is most of the work. The Cosmograph-ready CSVs, the GEXF exports, the public links to interactive visualizations - these aren't analysis, they're packaging. But they're what makes the result inspectable by someone who isn't going to clone the repo, and they're disproportionately impactful per hour spent.
Curated recommendation networks are structurally different from organic co-purchase networks. The modularity gap between the two isn't just "Digitec is cleaner than Amazon" - it's that an algorithmically-curated recommendation graph has different topological properties than an empirically-observed purchase graph. Anyone reusing this dataset should keep that in mind when comparing to literature.
Future Improvements
- ·Full-catalog scrape. The current analysis covers two categories. A full-catalog Digitec graph would let cross-category community detection reveal the actual high-level taxonomy that Digitec implicitly enforces through its recommender, which would be directly comparable to Amazon's published co-purchase structure.
- ·Temporal dynamics. Re-scraping the same categories at intervals would expose how recommendation graphs shift in response to inventory changes, promotions, and seasonal effects. This is novel - the published Amazon work is single-snapshot.
- ·User-behavior overlay. If session or purchase data were available, the comparison of recommendation-graph communities vs. actual co-purchase communities on the same catalog would be a clean test of how well curated recommendations match revealed preference.
- ·Faster community detection at scale. Replace GNM with Infomap or Leiden for any catalog-scale scrape. Leiden in particular fixes the resolution-limit and disconnected-community issues in Louvain and would be the natural production choice.
- ·Price-network interaction, done properly. With timestamps tightened to a single scrape window per category, the centrality-vs-price correlation question is answerable. It just needs the scraping discipline that we deprioritized.