
Master project, UZH (IVDA Lab). 🏆 Best Pictorial, ACM CHItaly 2025. 📄 CHItaly 2025: 10.1145/3750069.3750396 · 📄 RecSys 2025: 10.1145/3705328.3759337
Overview
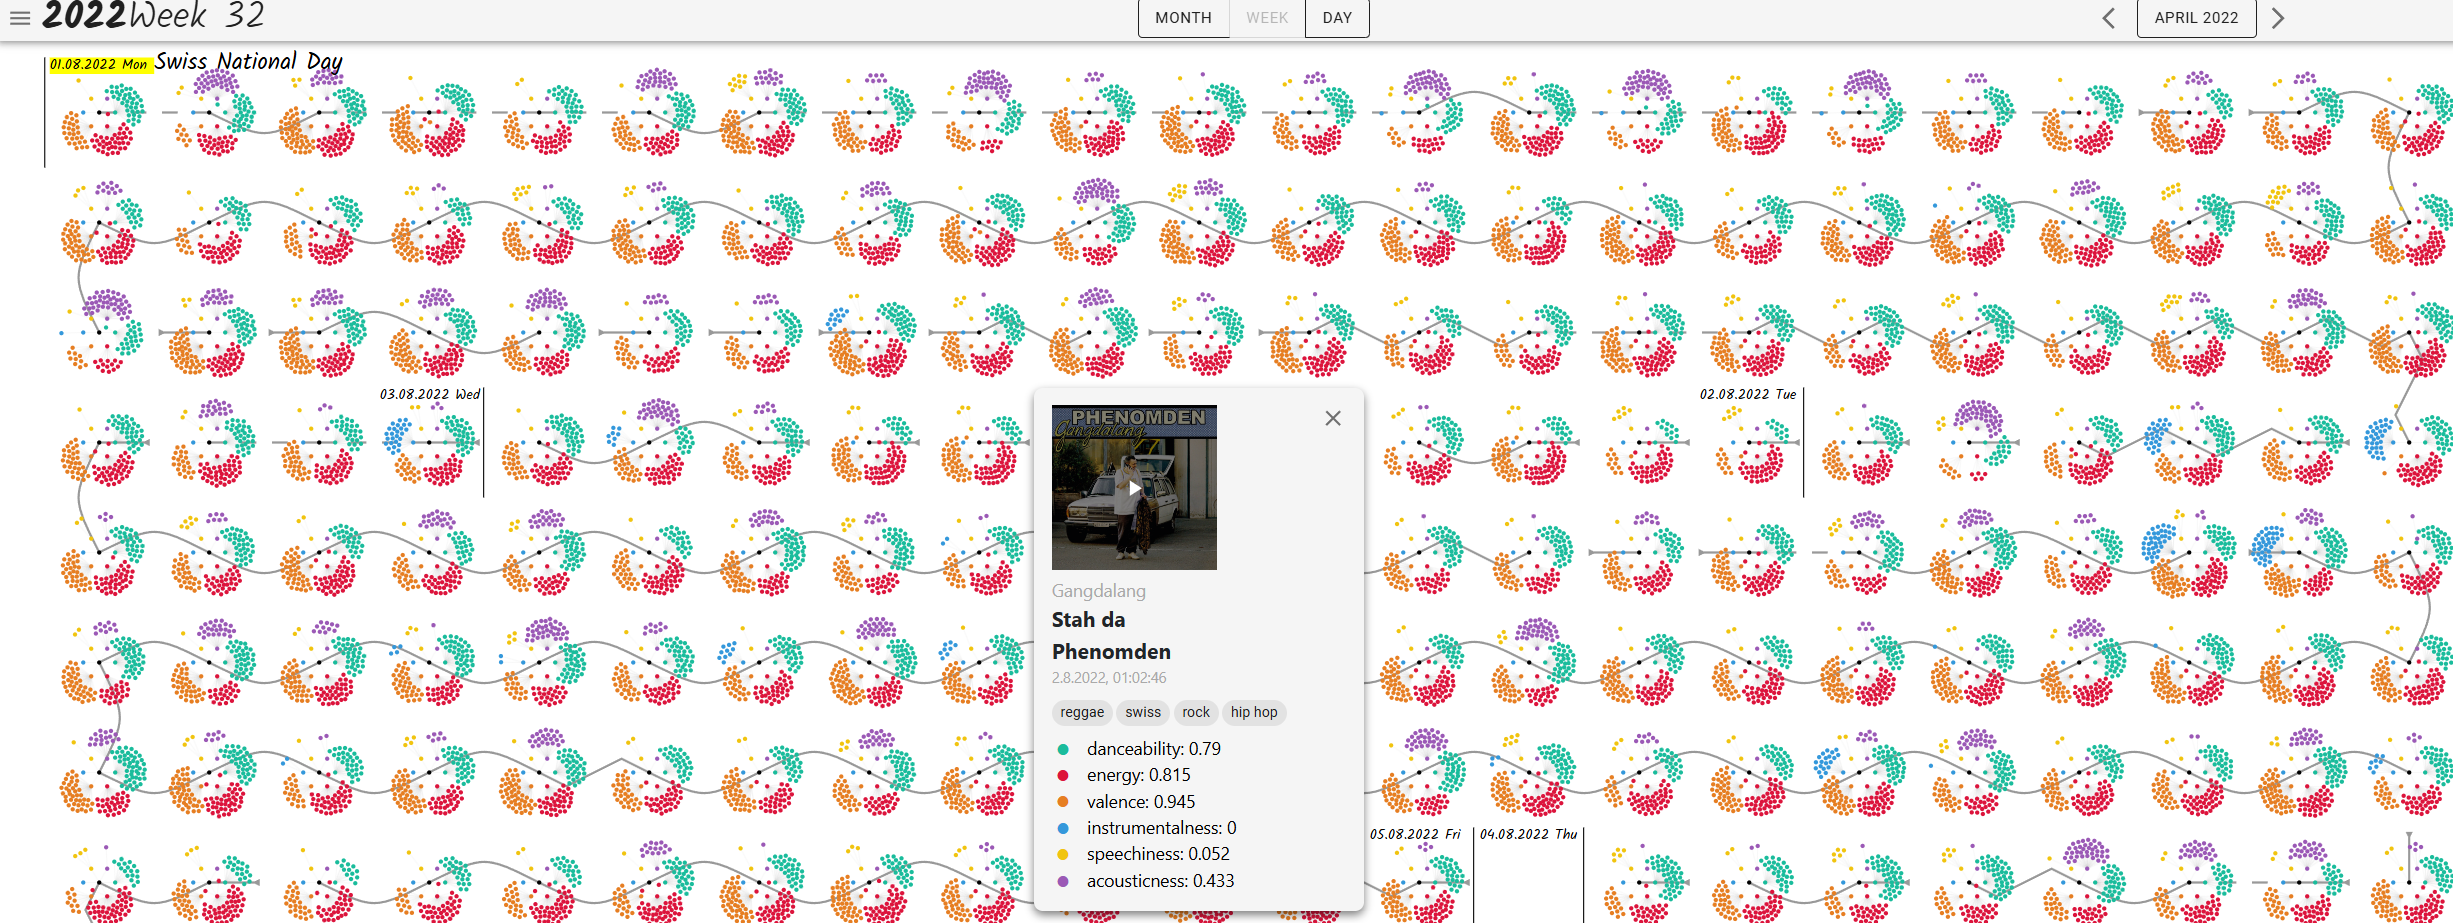
Built on ten years of one user's Spotify history (219,673 plays, 2013–2023), Blooming Beats is a personalized, contextualized and explainable recommender. The visualization is grounded in Giorgia Lupi's Data Humanism manifesto: the longer one looks, the more structure emerges.
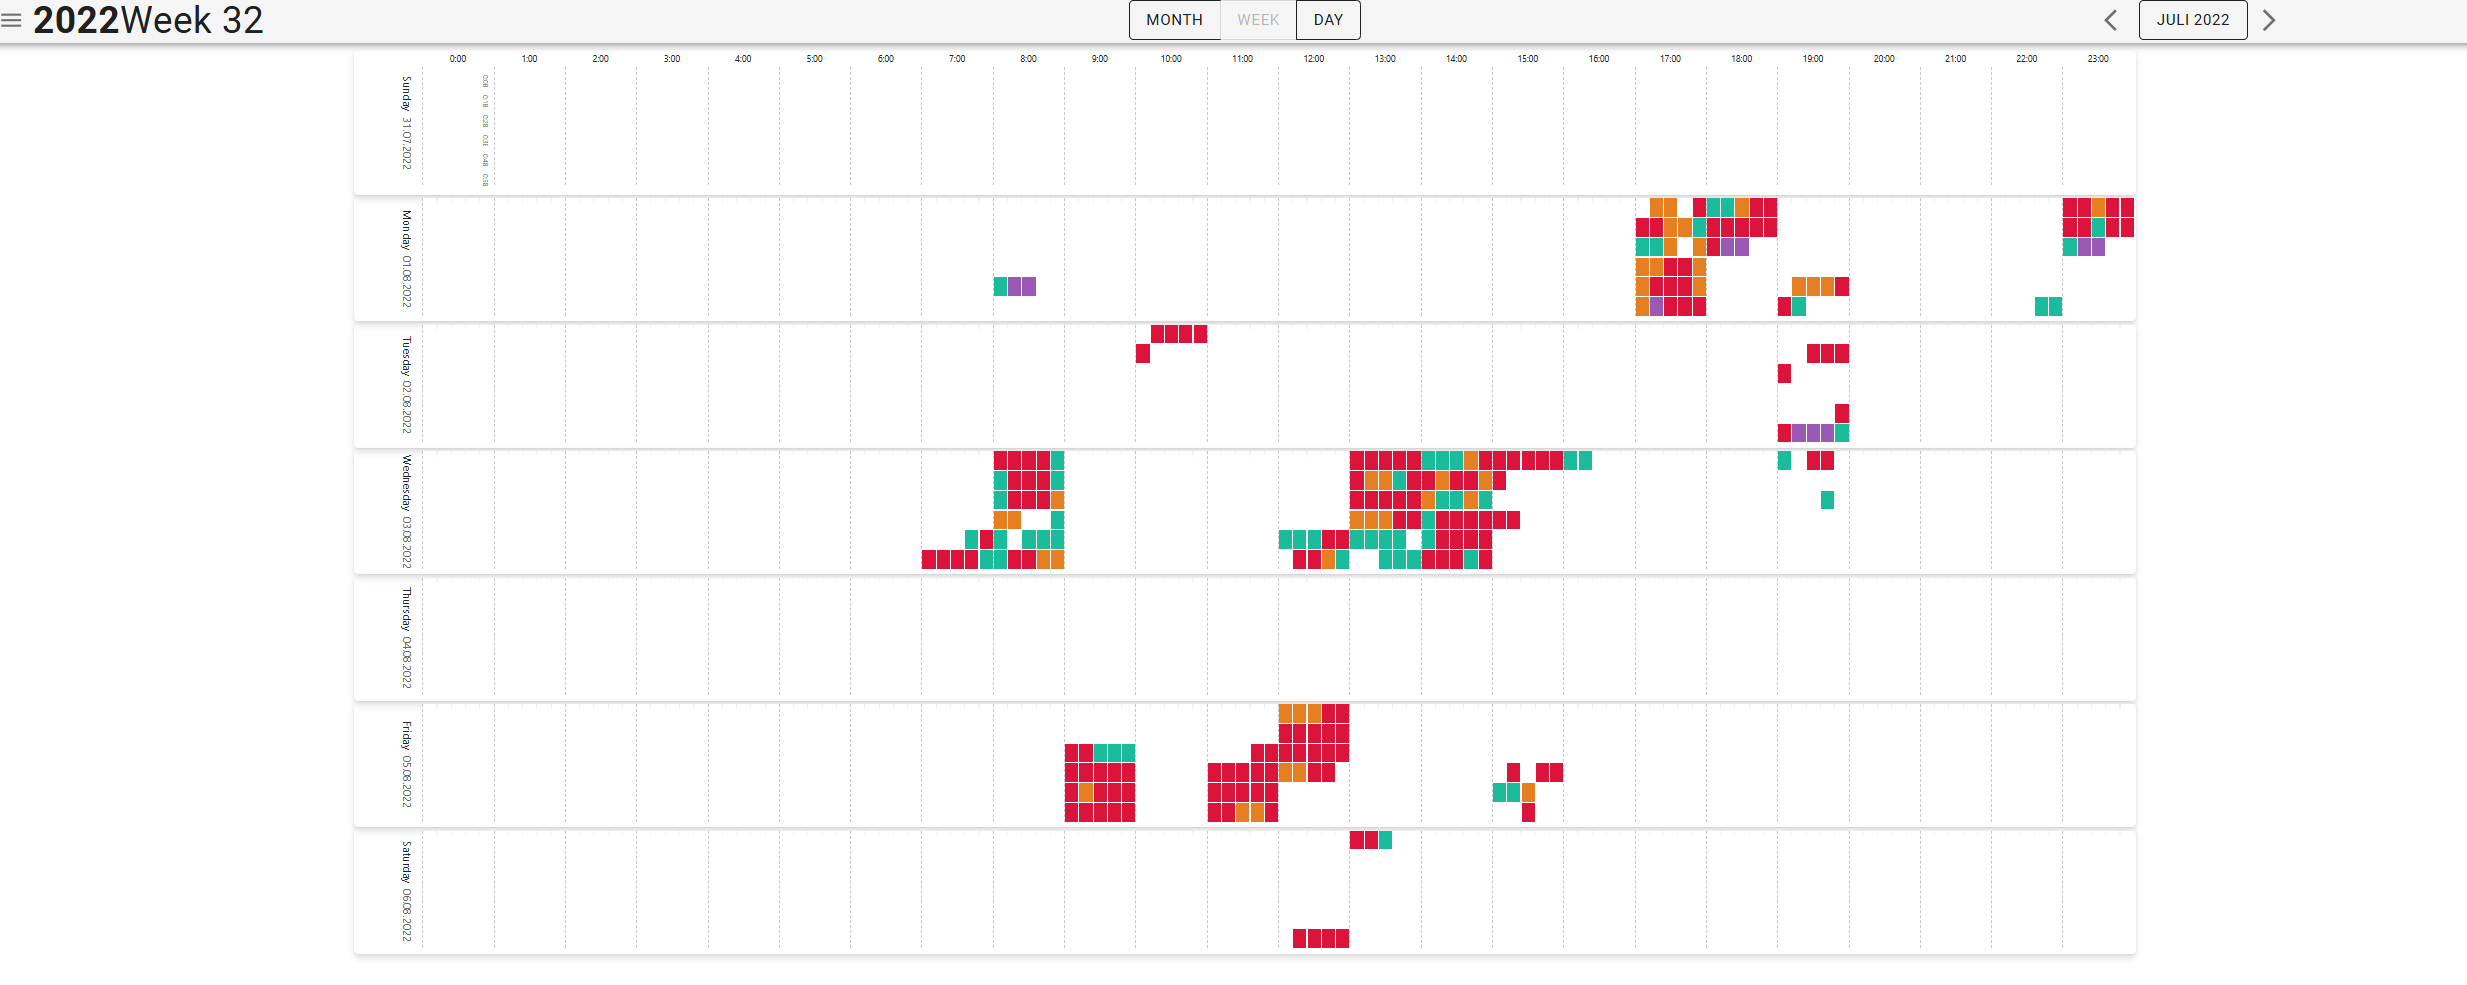
Three views: a Data Humanistic view for contextual exploration, an Analytical view for time-based overview, and an Explainable Recommendation view that exposes the rationale behind every suggestion. Evaluated with eight participants. Published as a Best Pictorial at ACM CHItaly 2025 and as a full paper at ACM RecSys 2025.
Research Questions
- ·RQ1. How can a personal and contextualized listening-history visualization system enhance the data exploration experience?
- ·RQ2. How can such a system contribute to more humane and personalized recommendations?
System
Each track is encoded as a small graph of six Spotify audio features (danceability, energy, valence, instrumentalness, speechiness, acousticness). Dots per feature scale with value × 100. Connections between successive song-graphs encode listening behaviour (flow / skipped / stopped / next). To keep the SVG-heavy views performant, song representations are pre-rendered offline by a Node.js process running D3's force simulation against an emulated DOM.
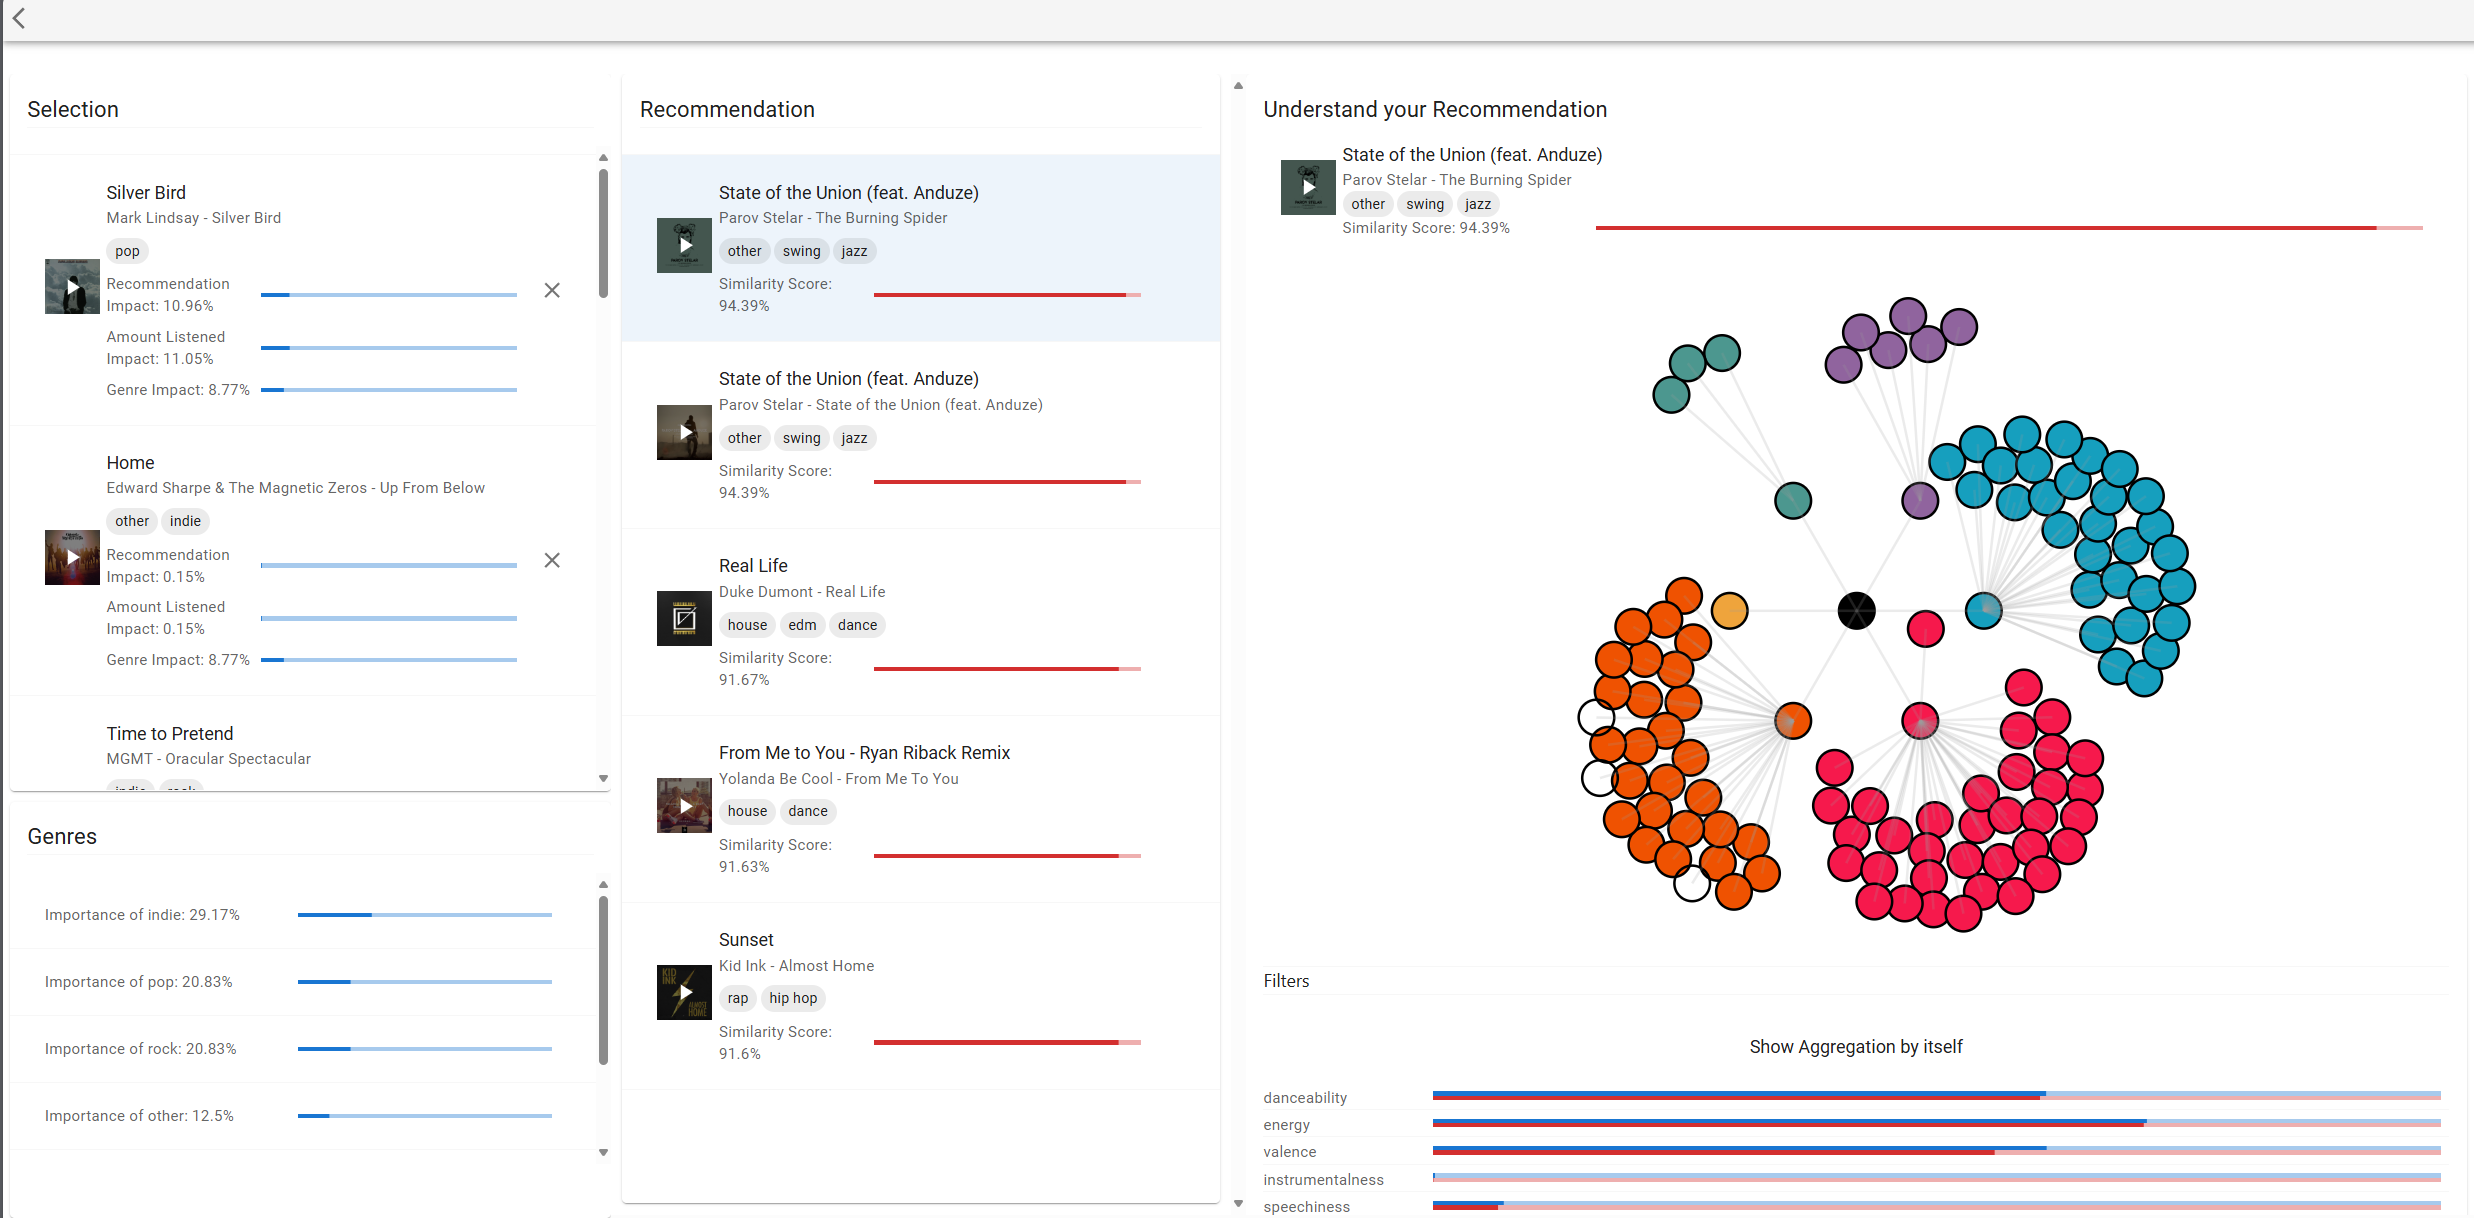
Recommendation Algorithm
A content-based recommender, since the dataset contains a single user's history. Each song receives two weights (proportion listened to, and genre importance within the selection), which are normalized and used to form an aggregated representation. Both weights are surfaced in the UI as Amount Listened Impact and Genre Impact, so every recommendation carries its own explanation.
Candidates are ranked by Euclidean distance to r, chosen over cosine similarity after qualitative inspection and informed by Steck et al. (2024). The endpoint returns the top n = 5.
Evaluation
Eight participants, four-section protocol: background, view-specific Likert ratings, an explainability task (find a relatable pattern → generate a recommendation → understand it), and the System Usability Scale. Half the participants started with the Data Humanistic view, half with the Analytical view.
The Data Humanistic view produced high engagement but was perceived as overwhelming by several participants. The Analytical view scored higher on overview clarity, lower on enjoyment, validating the decision to keep both side by side. All participants completed the explainability task. Both research questions were answered affirmatively.
Learnings
- ·Design-driven data, not data-driven design. Sketching the visual language first and asking what data fits it produced a more distinctive artefact than starting from the dataframe would have.
- ·Two views are better than one. The Analytical view exists because MVP feedback showed the Data Humanistic view alone could not serve as a navigation surface.
- ·Explanation lives inside the model. The weights driving the recommendation are surfaced as first-class UI elements, not post-hoc rationalization.
- ·Pre-rendering pays. Moving the D3 force simulation out of the request path was the difference between a usable prototype and a frustrating one.
Future Work
- ·Event-based navigation alongside the existing date picker.
- ·Lyrics-derived (NLP) and raw-audio features to complement the eight Spotify attributes.
- ·Scrutability: bidirectional communication that lets users reshape recommender behaviour.
- ·Bring-your-own-data: user upload and annotation of a personal Spotify export.
Recognition
🏆 Best Pictorial Award, ACM CHItaly 2025 Blooming Beats: An Interactive Explainable Recommender System for Exploring Personal Music Narratives through Data Humanism Principles 10.1145/3750069.3750396
ACM RecSys 2025 Blooming Beats: An Interactive Music Recommender System Grounded in TRACE Principles and Data Humanism 10.1145/3705328.3759337